Add shipping traffic
In this blog post, we’ll explore how add a shipping traffic information from a tif file in QGIS.
Intro
The Baltic Sea is one of the busiest seas in the world, with sea transport accounting for 15% of global sea freight (Rutkowsky & Kubacka 2023).
In addition, the construction and maintenance of OWFs is further associated with a strong increase in shipping activities in and around OWFs (Exo et al., 2003).
In this blog post, we’ll explore how add a shipping traffic information from a tif file in QGIS.
Shapefile
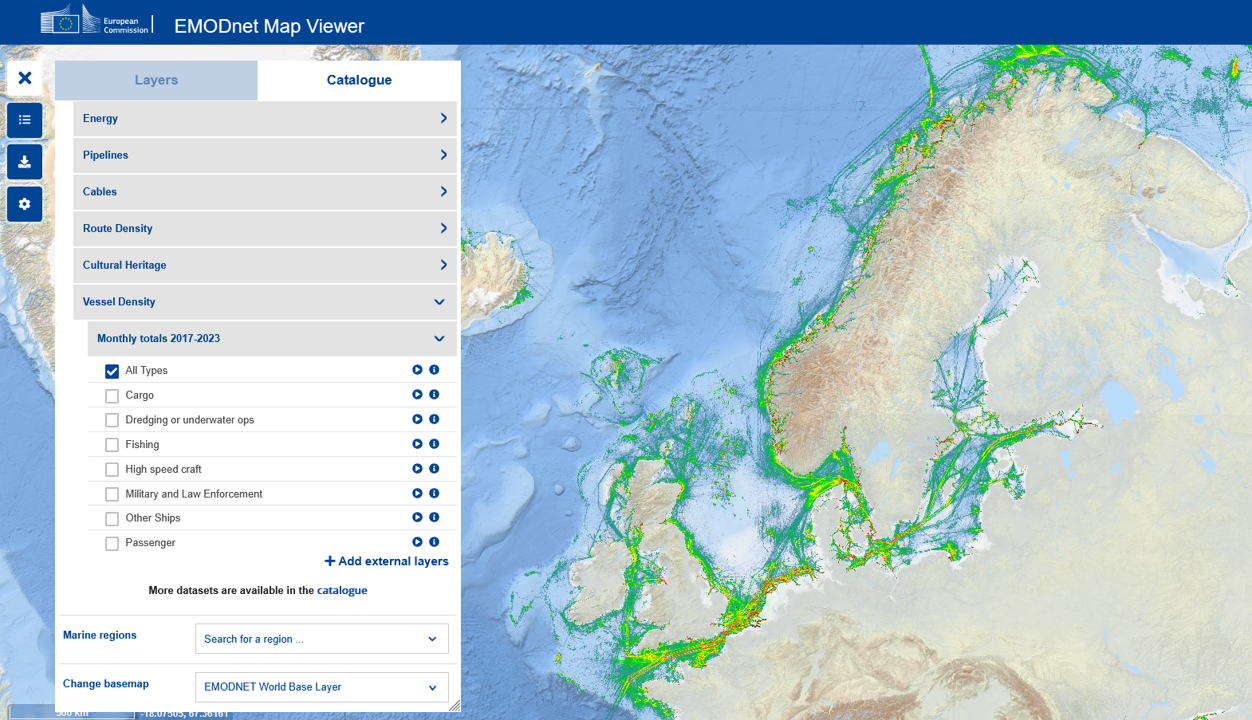
To download shipping traffic data go to EMODnet Map Viewer > Catalogue > EMODnet Human Activities > Vessel density > Monthly totals 2017-2023 > All Types > Click on the “i” icon > Select Download.
A zip file named “EMODnet_HA_Vessel_Density_all_2017-2023 would be downloaded. For the period of December 2023, the raster information is under vesseldensity_all_20231201.tif.
Load
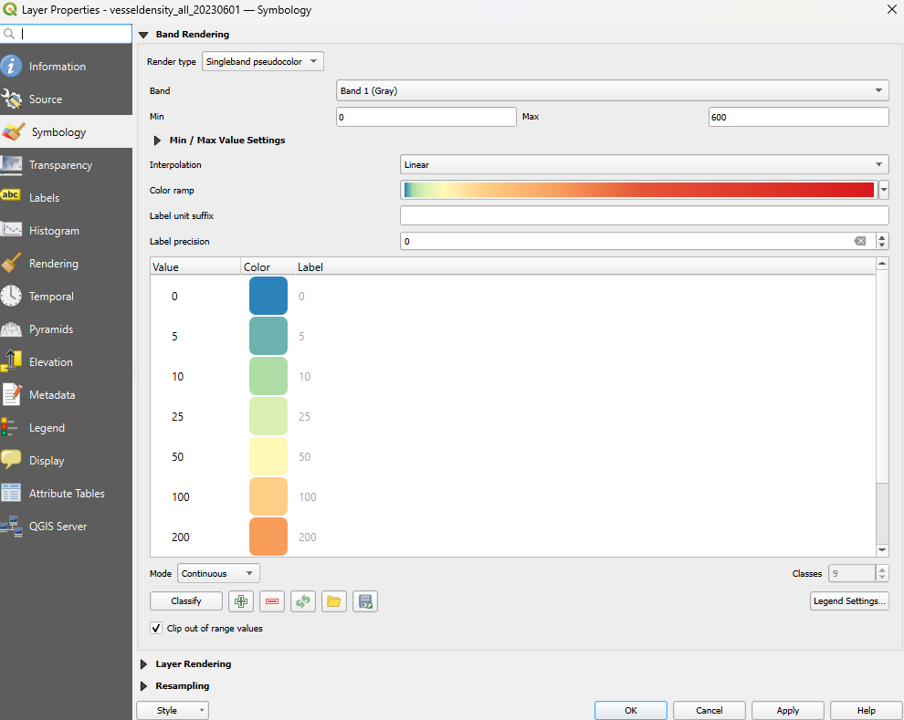
Load the files (tif) from 20230101 to 20231201 in QGIS. Once loaded, change Style for better visualization. In this example, under Singleband Pseudocolor, I selected 9 classes with a continuous classification. I then manually adjusted the class breaks and color scale to better represent the vessel density values.
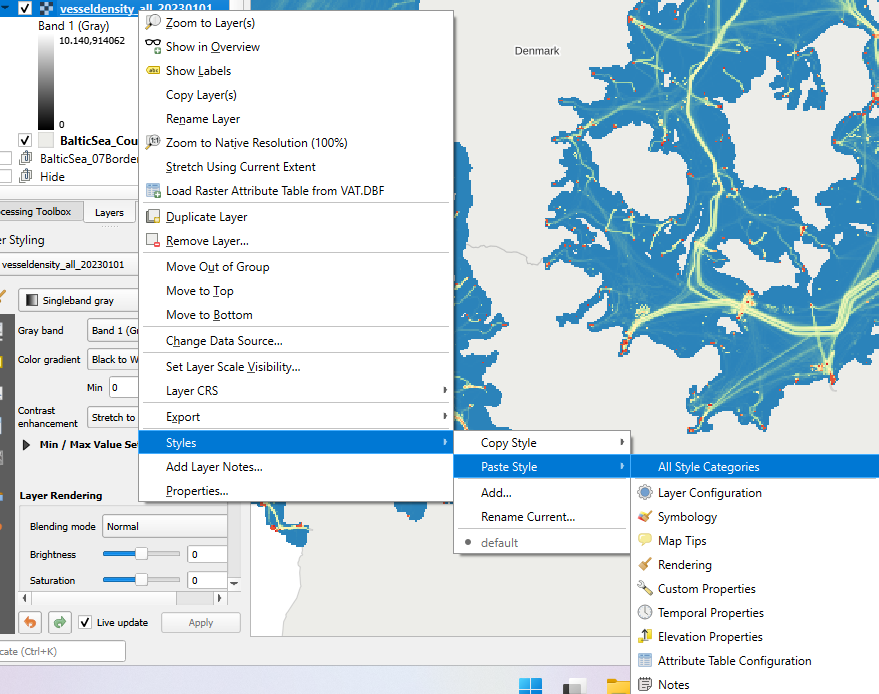
Once the style is defined, go to Styles > Copy Style > All Style Categories to copy the complete styling configuration.
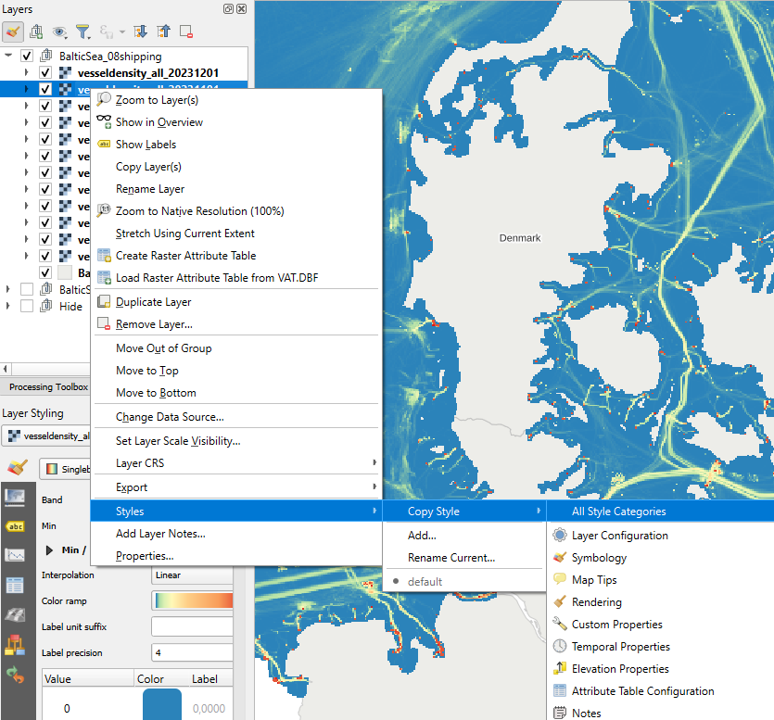
For the other layers, go to Styles > Paste Style > All Style Categories to apply the copied styling configuration.
Layout
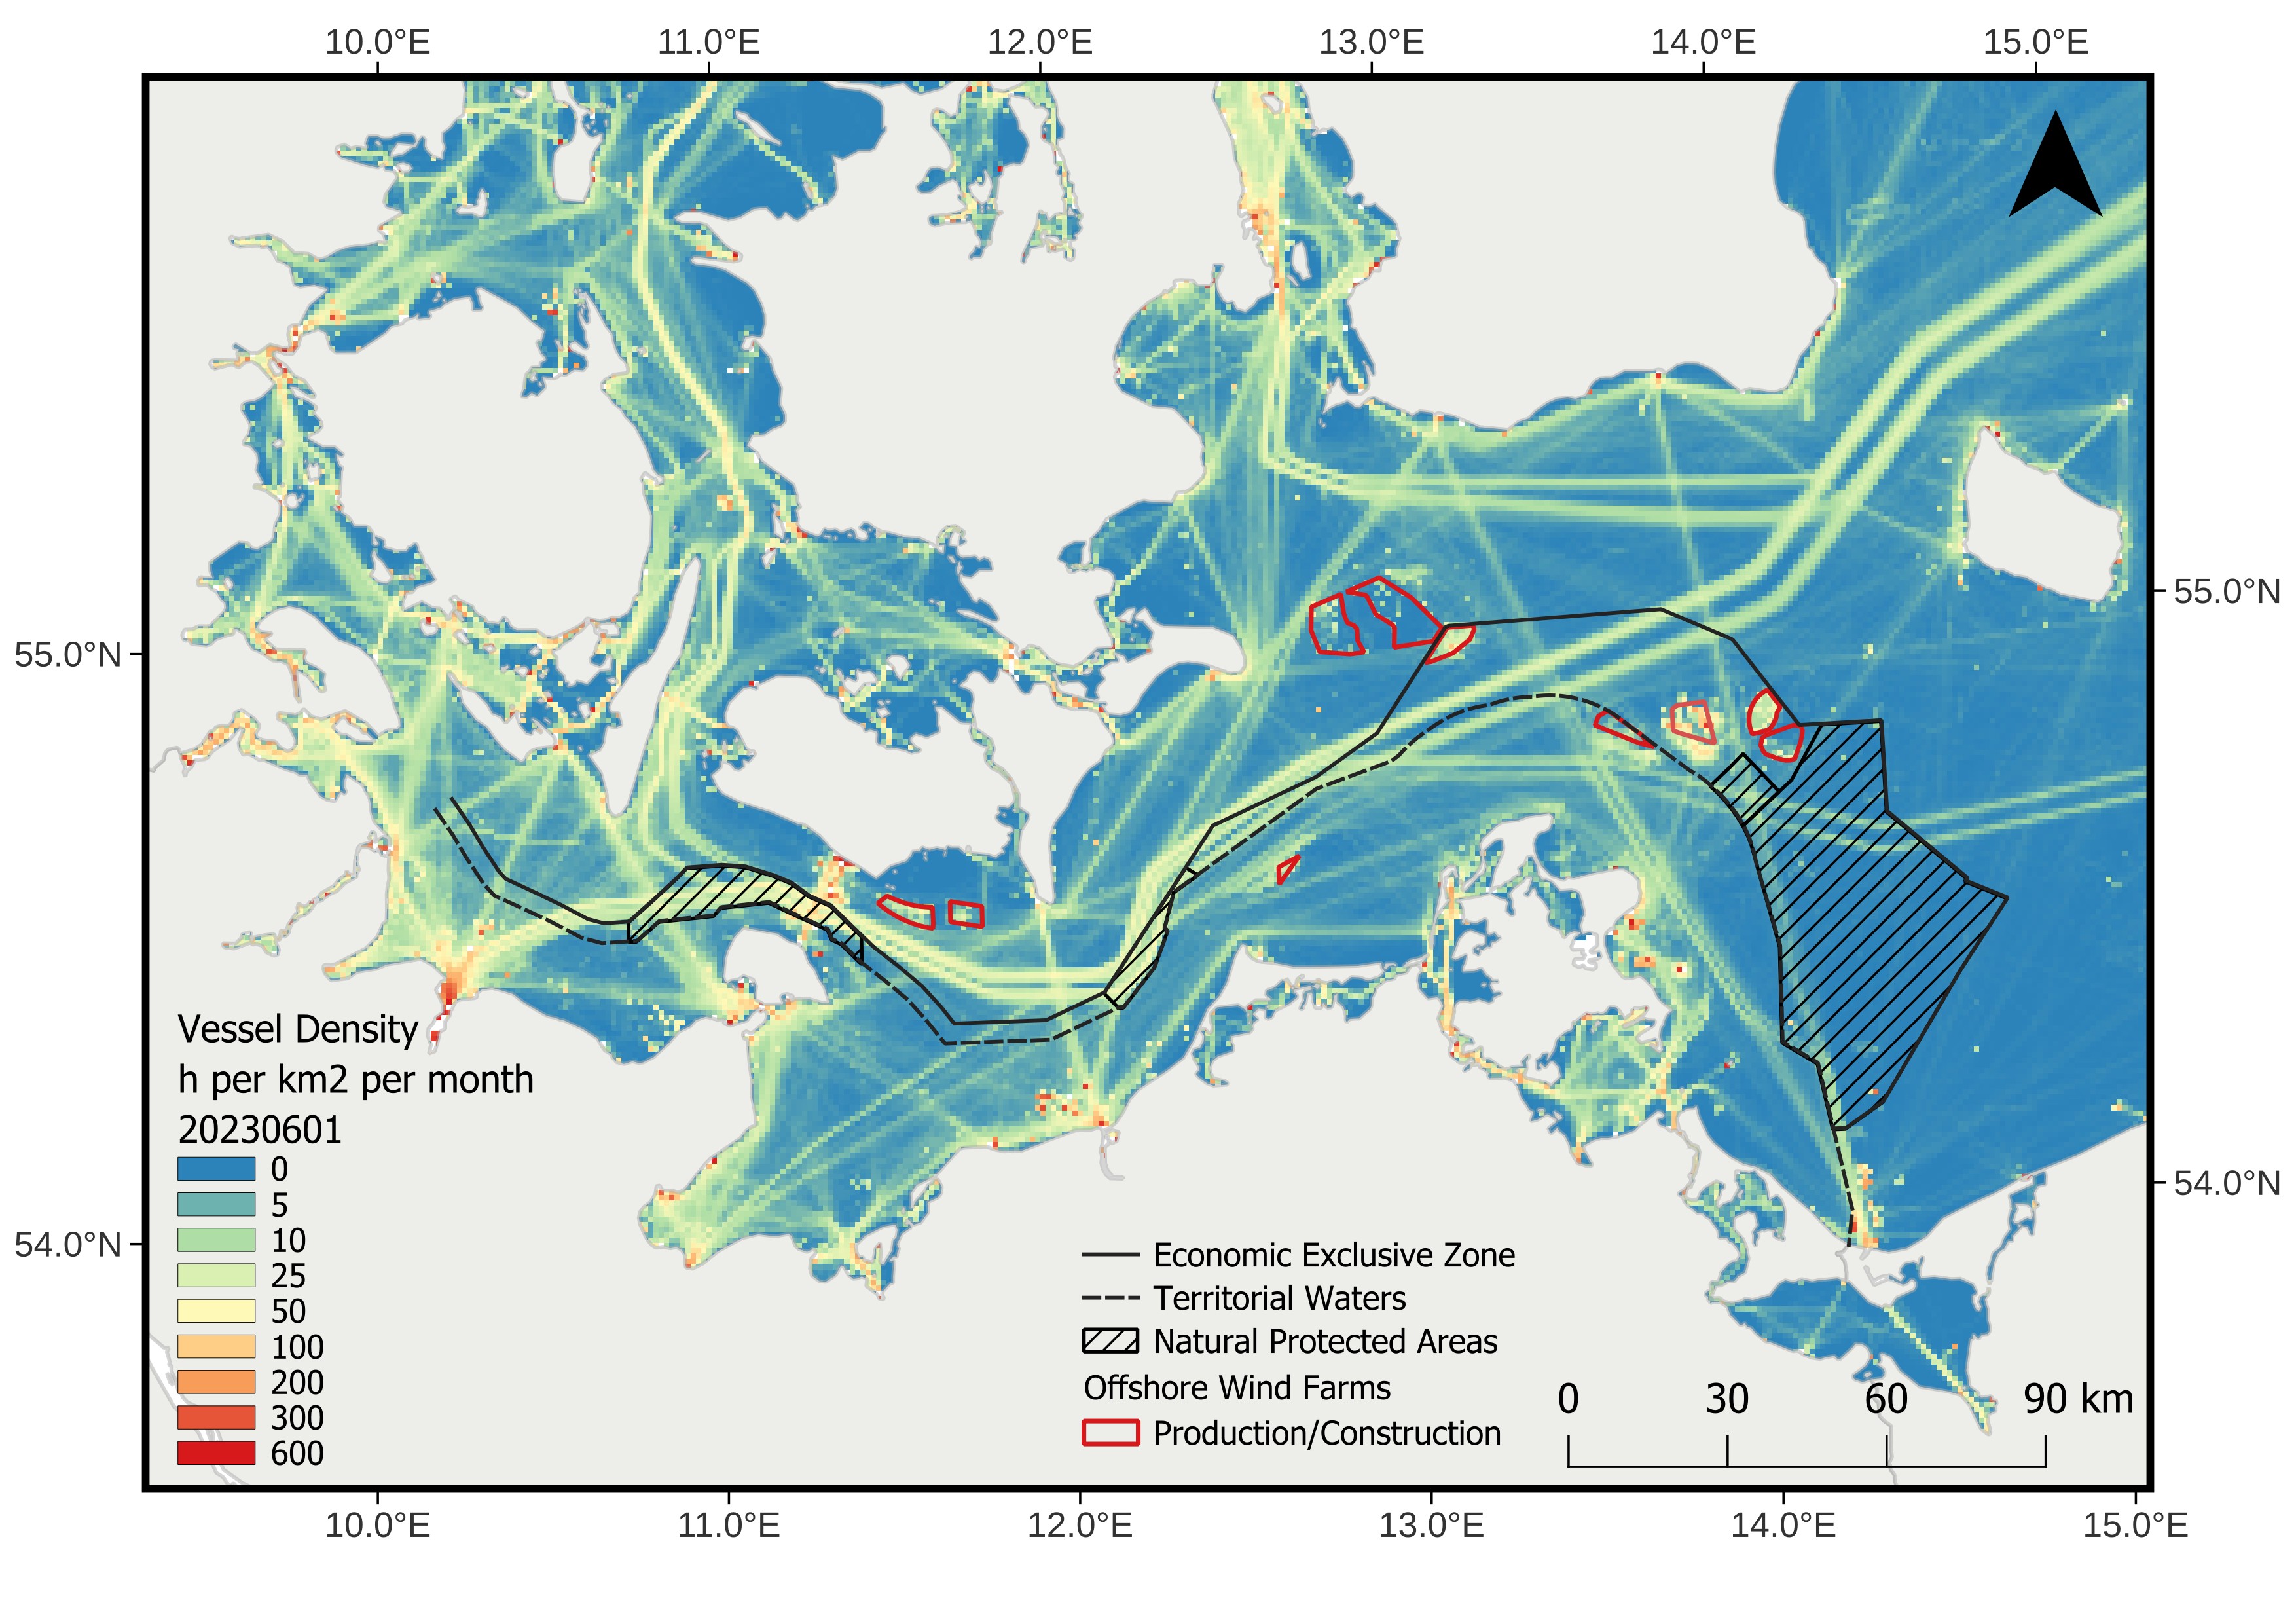
In this example, I selected the vessel density color scale, EEZ, Natura, and OWF layers (see previous posts for how to add this polygons using QGIS). For the OWF layer, I displayed only projects that are currently in production or under construction. Interestingly, the OWF show high densities of shipping traffic.