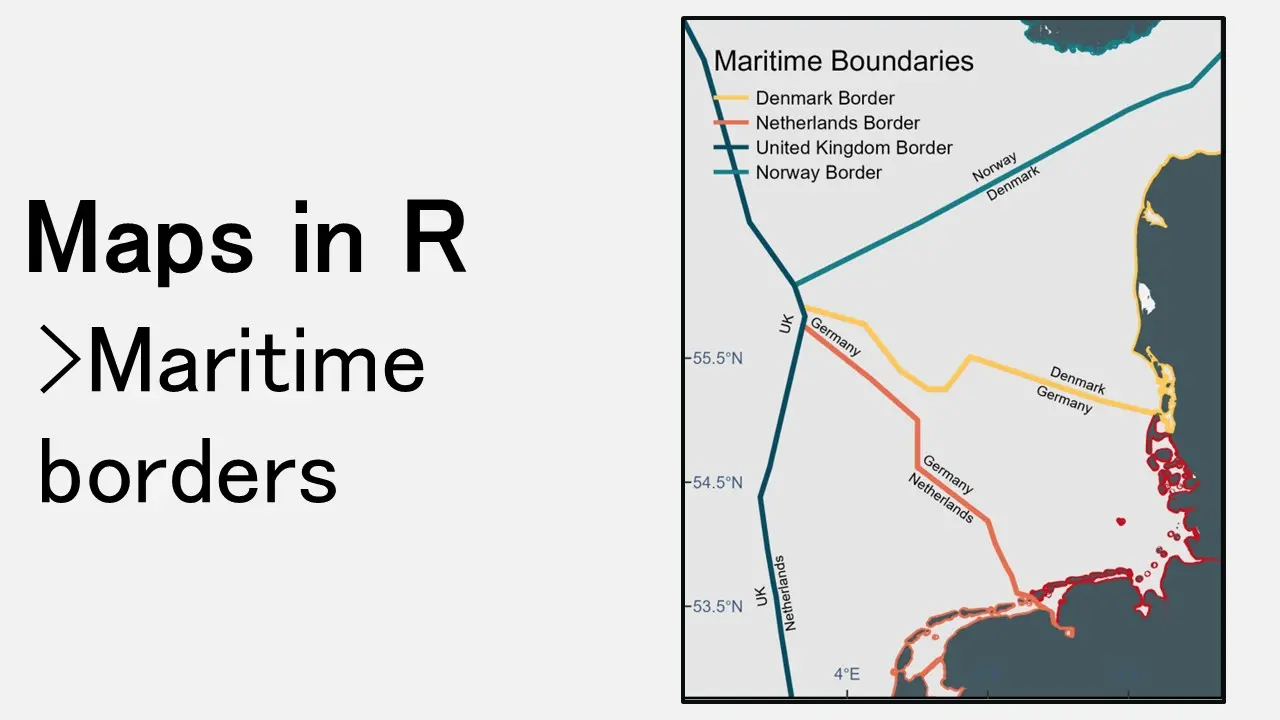
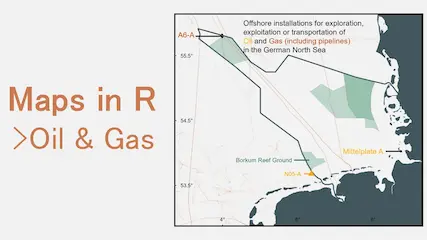
Blog

Shipping traffic

R
ggplot2
English
Y2025

In this blog post, I demonstrate how to visualize shipping traffic data using R. The tutorial covers downloading the dataset from EMODnet, performing exploratory data analysis, and creating a map using ggplot2.

Light pollution

R
ggplot2
English
Y2025

In this month's post, I’ll show you how to create a map using radiance data, often associated with light pollution, collected by the Visible Infrared Imaging Radiometer Suite (VIIRS).

Sea surface temperature

R
ggplot2
English
Y2025

In this blog post, I walk you through the process of visualizing sea surface temperature in R. From downloading the dataset to reading it and creating a map using ggplot.

Fishing effort

R
ggplot2
English
Y2025

In this blog post, I walk you through the process of visualizing Global Fishing Watch data in R, covering from downloading the dataset to reading it and creating a map using ggplot.

Distance to coast

R
ggplot2
English
Y2025

In this blog post, I share a step-by-step guide on how to use raster data from distance to the coast. I walk you through the steps I used using the North German Sea as an example.

Bathymetry

R
ggplot2
English
Y2025

Here are the steps I used for creating a bathymetric map in R. From where to download bathymetric data to how to read it and plot it in R.

tmap

R
English
Y2024

Create an interactive map to explore your data.

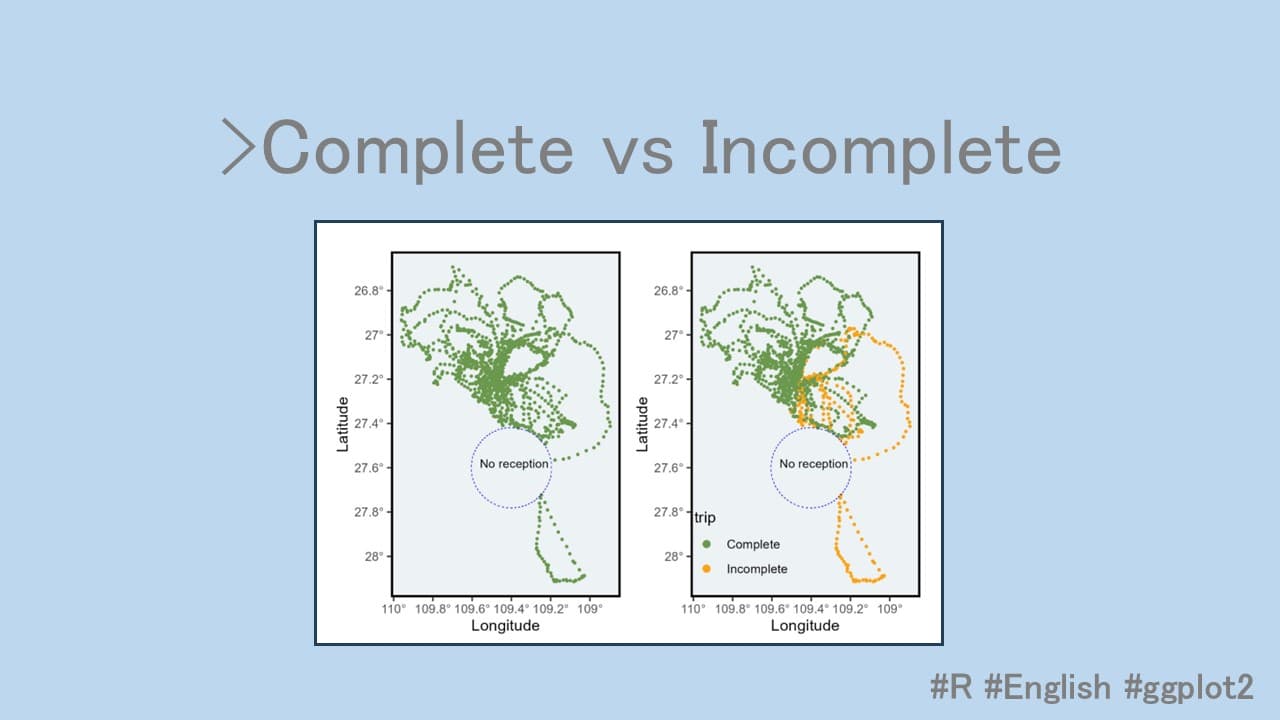
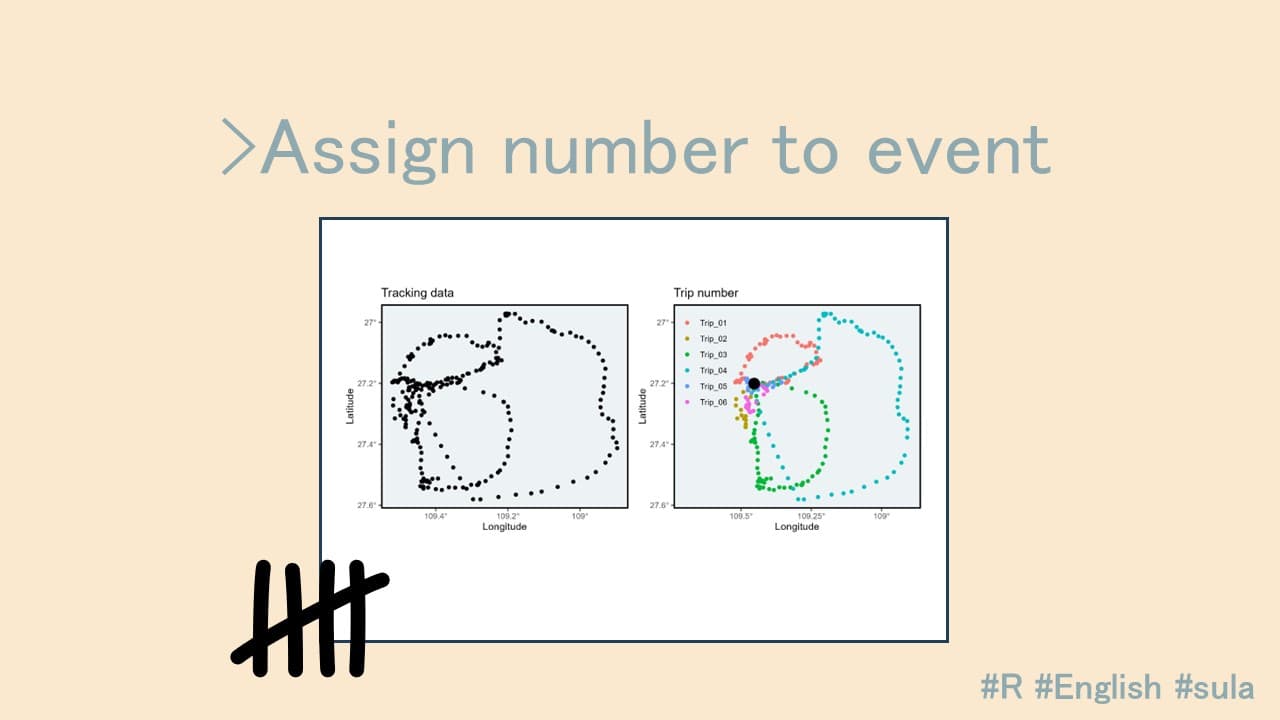
Complete or incomplete trips

R
ggplot2
English
Y2024

Identify trips with large gaps and classify the trip as complete or incomplete.

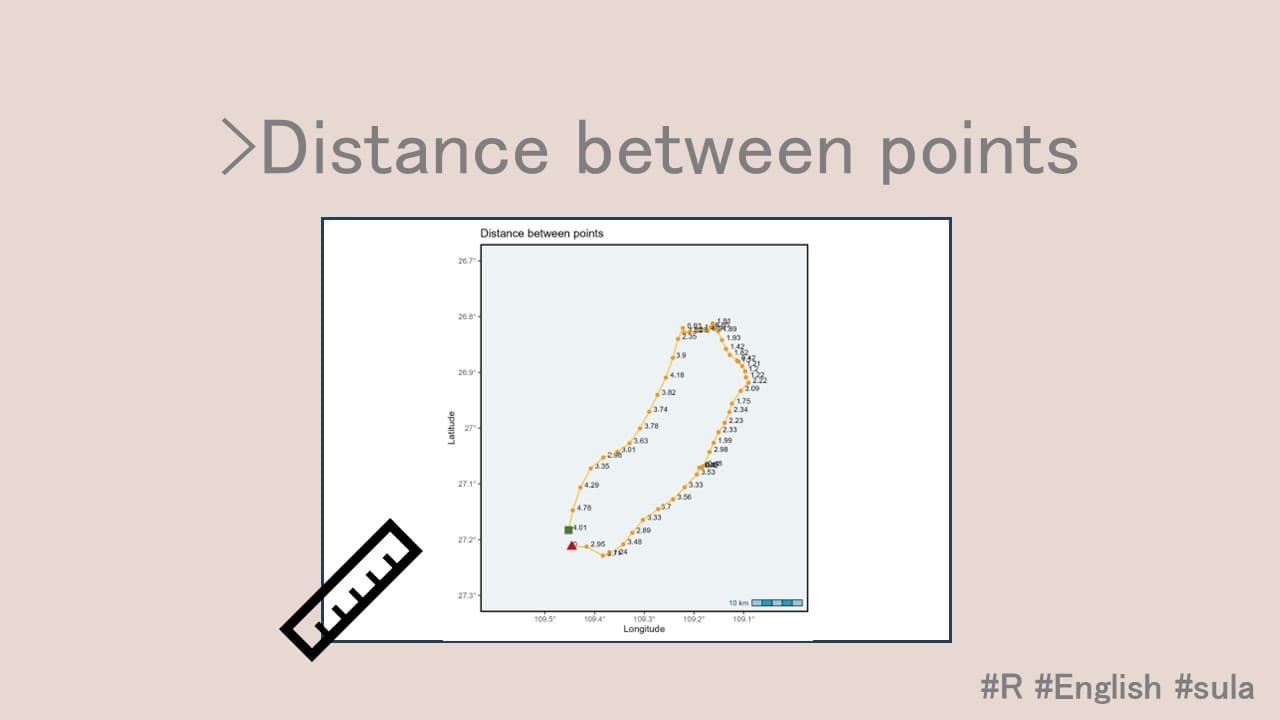
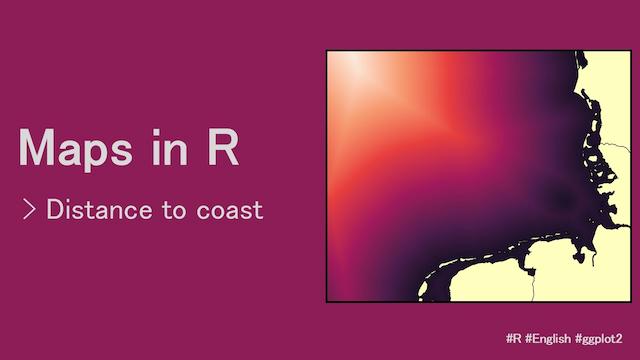
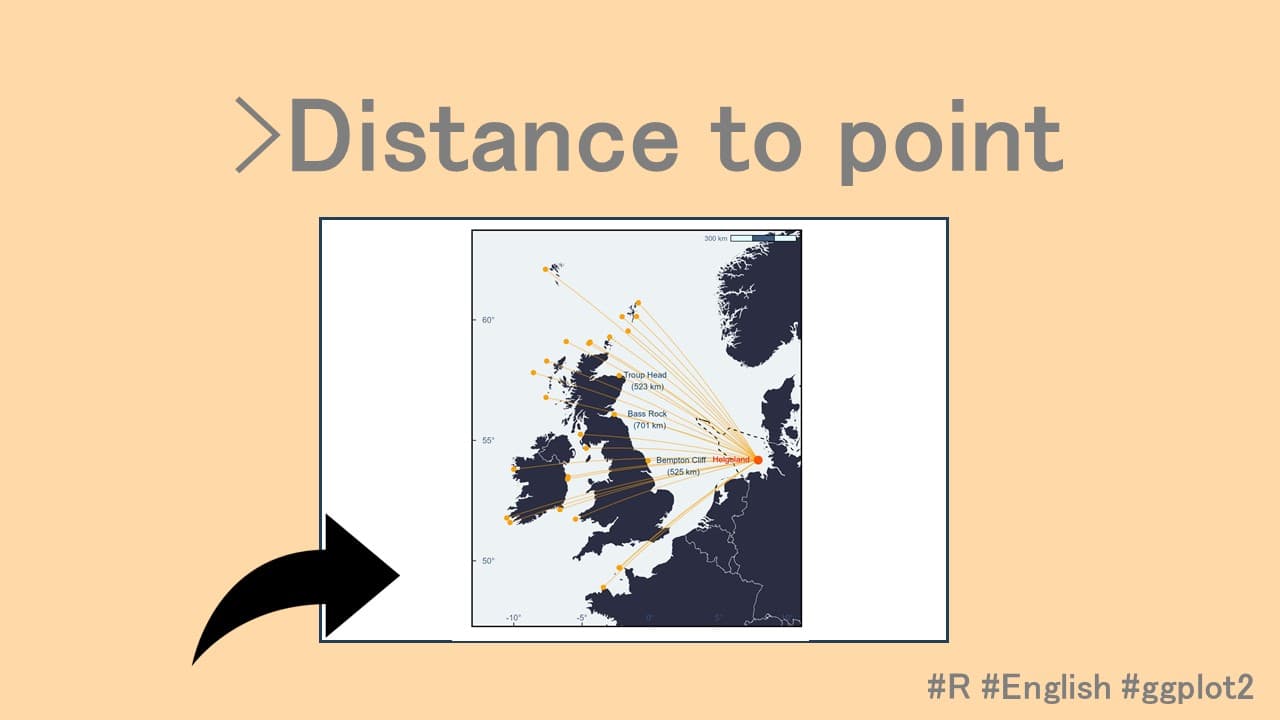
Distance between consecutive points

R
ggplot2
English
Y2024

This posts allows to calculate distance between consecutive locations.
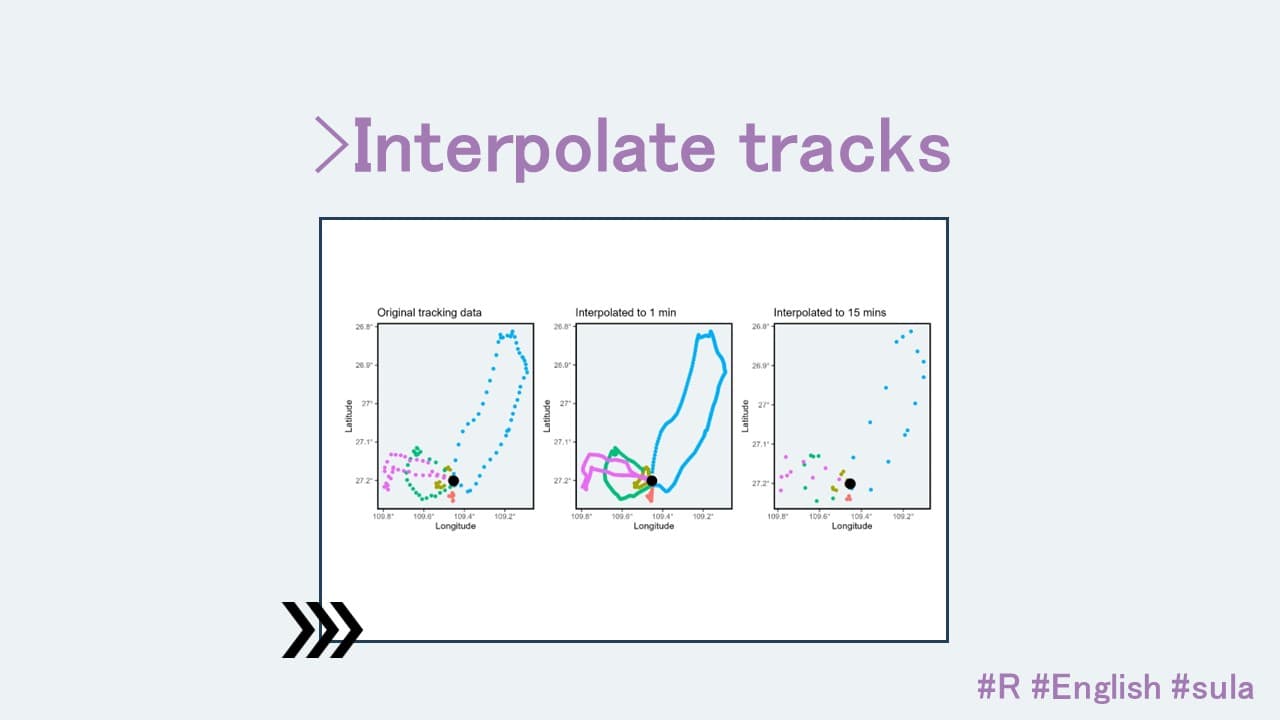
Identify events

R
ggplot2
English
Y2024

Assign a number to each event.

Remove undesired locations

R
ggplot2
English
Y2024

Create a buffer to remove locations.

Interpolate a path

R
ggplot2
English
Y2024

Doing a linear interpolation of tracks of animals.

Distance from point

R
ggplot2
English
Y2024

Calculate distance from a point.

Read images using R

R
English
Y2024

Add text and margins on images.

Create a buffer

R
ggplot2
English
Y2024

This post is about how to create a spatial buffer of 1 km around a point.

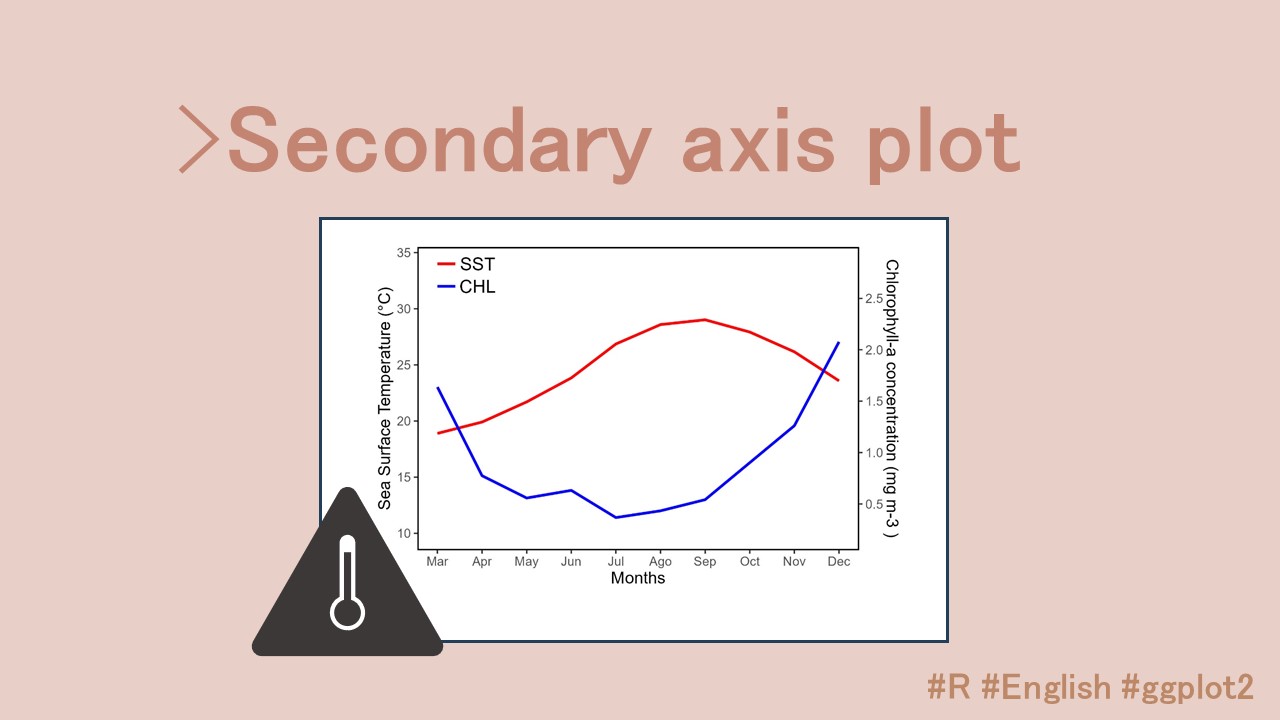
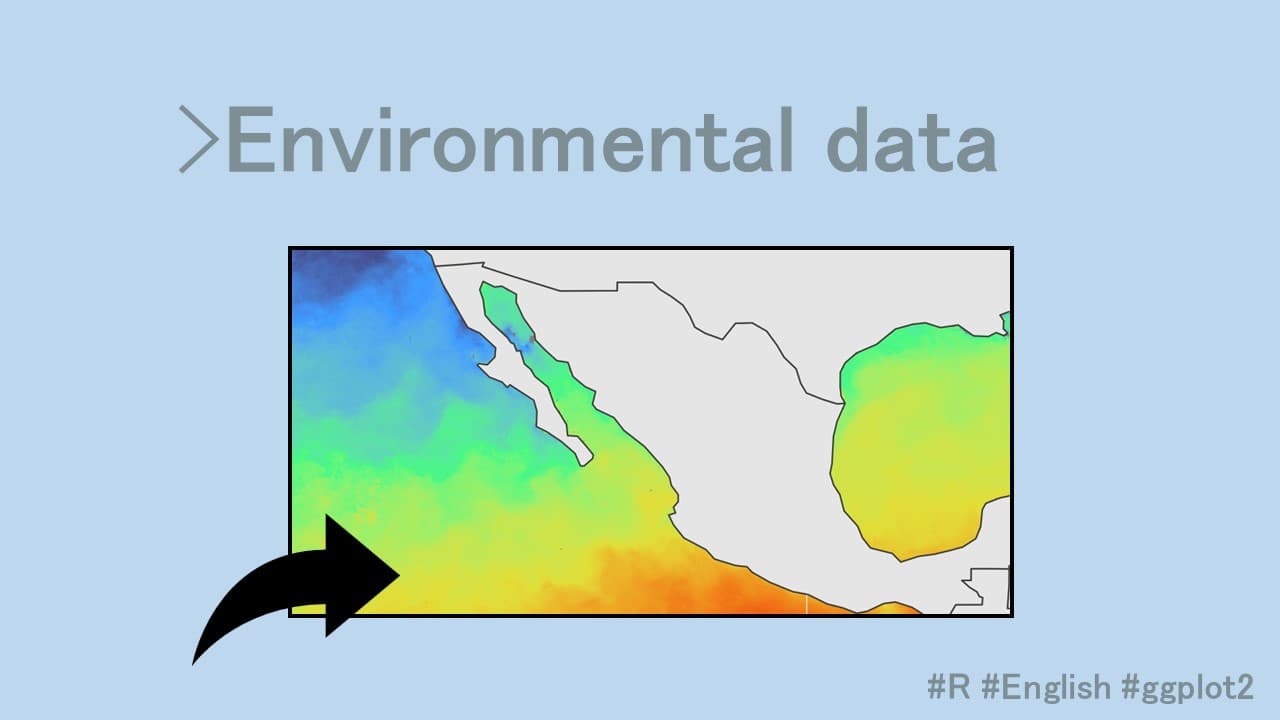
Secondary-axis environmental plot

R
ggplot2
English
Y2024

Create a secondary-axis plot from SST and CHL.

Environmental variables

R
ggplot2
English
Y2024

Download and plot SST data from a specific period.

Create a calendar

R
ggplot2
English
Y2024

This post is to create a calendar.

using arrows

R
ggplot2
English
Y2023

This post is on how to use arrows in a plot.

secondary x title

R
ggplot2
English
Y2023

This post is on how to articially create a secondary x title.

Inside legend

R
ggplot2
English
Y2023

Create a custom legend using annotations of text and rectangles inside the plot.

Reference legend multiplots

R
ggplot2
English
Y2023

Create a plot to be use as reference legend for multiple plots

Custom legends in a map

R
ggplot2
English
Y2023

Place the legend inside the map and custom the legend title

Custom points in a map

R
ggplot2
English
Y2023

Plot different size, color and shape points

gganimate

R
ggplot2
English
Y2023

Create an animation of your tracks.

Github page presentations

R
Git
English
Y2023

Publish your slides from a html file.

Grid, Raster, Colors

R
English
Y2023

Create a grid, then a raster, and plot them with your custom colors.

Mapping in R

R
ggplot2
English
Y2023

Create a map of Europe in ggplot2.

PSG2023

Presentation
English

Habitat use of Kelp gulls

Subset shapefile

English
R
Y2023

Extract a specific polygon from a shapefile and export it as new shapefile.

Custom made polygon

QGIS
Biologging
English
Y2023

Create a polygon in QGIS using google maps as background

Day and night

R
Biologging
English
Y2022

Create a column with the classification day or night
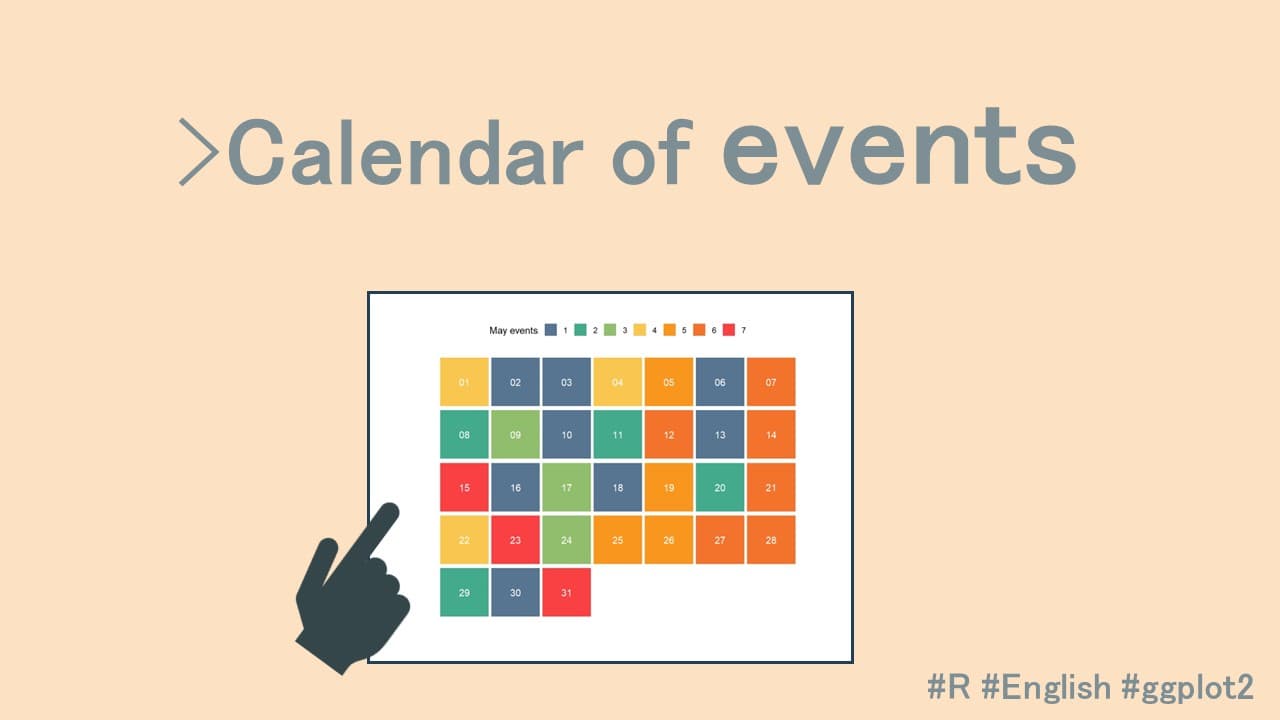
Mastodon

Español
Y2022

Migrando a mastodon

Identify gaps

R
Biologging
English
Y2022

Find the gaps between recordings

Kernel UD considerations

R
Biologging
English
Y2022

Some things to consider before making kernel density estimations.

Count days

R
Biologging
English
Y2022

How to add a day number as a column, and see differences as days pass.

Locate nest

R
Biologging
English
Y2022

How to locate the nest of the bird using their GPS locations.

Time formats

R
Biologging
English
Y2022

How to convert your time to a format that R can understand as time.

Speed

R
Biologging
English
Y2022

How to calculate speed using time and distance between points.

Habitat use

R
Biologging
English
Y2022

How to assign habitat use to animal locations.

Interpolation

R
Biologging
English
Y2022

How to interpolate tracking data.

Time overlaps

R
Biologging
English
Y2022

Find overlapping time periods.

Shared Areas

R
English
Y2022

Calculate area per polygon, their intersection and the shared areas.

EMbC

R
Biologging
English
Y2021

Classify behaviours using Expectation-Maximization Binary Clustering.

Git & Github

R
Git
English
Y2021

A short intro.

BLS7

Presentation
English

Diel foraging behaviour of Humboldt penguins *Spheniscus humboldti* at Tilgo Island, Northern Chile.

Home Range & adehabitatHR

R
Biologging
English
Y2021

Export polygons generated from adehabitat.

Colores en mapas

QGIS
R
Español
Y2021

Cambiar colores en un en un mapa en ggplot2 y en QGIS.

Paquetes

R
Español
Package
Y2023

Como crear tu primer paquete con datos y algunas funciones.

CV

R
Español
Y2021

Como crear un curriculo en RStudio usando el paquete vitae.

Pagina distill

R
Español
Y2021

Como crear tu propia pagina y agregar contenidos.

More articles »

Blog