Bath_tif<-'https://github.com/MiriamLL/data_supporting_webpage/raw/refs/heads/main/Blog/2025/Bathymetry/gebco_2024_n60.0_s50.0_w1.0_e9.0.tif'Bathymetry
r
ggplot2
germansea
Y2025
Here are the steps I used for creating a bathymetric map in R. From where to download bathymetric data to how to read it and plot it in R.
Intro
Bathymetry gives us information on the water depth around an area.
This post includes:
- Download raster data
- Read and subset raster data
- Plot raster data
Download raster data
GEBCO: General Bathymetry Chart of the Oceans provides information from bathymetry in the ocean.
To download visit webpage
Go to:
- Download data for user-defined areas
- Use the application
- Add your coordinates -here I use 1 to 10 and 50 to 60-
- Add to basket and download
Load
To download test data in tif format click here.
Select the directory where the information is stored, or as here, use the data directly form the repository.
Load the terra package for reading raster data
library(terra)The function rast helps to read raster data - replacing package raster
Bath_file<-rast(Bath_tif)Change to data frame
Bath_dataframe <- as.data.frame(Bath_file, xy = TRUE)Alternatively, use the test information included in the package GermanNorthSea
##devtools::install_github("MiriamLL/GermanNorthSea")
library(GermanNorthSea)Bath_dataframe<-GermanNorthSea::German_bathLoad the package tidyverse
library(tidyverse)Use filter to subset your data
Bath_dataframe_sub <-Bath_dataframe  %>%
  filter(x > 2 & x < 10)%>%
  filter(y > 52 & y < 57)%>%
  rename(Bathymetry=3) %>%
  filter(Bathymetry < 10)
Plot
Load the package ggplot2
library(ggplot2)Plot your data using geom_raster
ggplot() +
  geom_raster(data = Bath_dataframe_sub , aes(x = x, y = y, fill = Bathymetry)) +
  scale_fill_viridis_c(option = "mako")+
  theme_void()+
  theme(legend.position='bottom')+
  xlab('Longitude')+ylab('Latitude')+
  coord_sf(xlim = c(3,9), ylim = c(53,56),
                    label_axes = list(top = "E", left = "N", bottom = 'E', right='N'))
Load the package sf
library(sf)Use the function st_transform to convert to the same CRS
German_land<-st_transform(GermanNorthSea::German_land, 4326)Add the land to the plot using geom_sf
Plot_bath<-ggplot() +
  geom_raster(data = Bath_dataframe_sub , aes(x = x, y = y, fill = Bathymetry)) +
  geom_sf(data = German_land, colour = 'black', fill = '#ffffbe')+
  scale_fill_viridis_c(option = "mako")+
  theme_void()+
  theme(legend.position='bottom')+
  xlab('Longitude')+ylab('Latitude')+
  coord_sf(xlim = c(3,9), ylim = c(53,56),
                    label_axes = list(top = "E", left = "N", bottom = 'E', right='N'))
Plot_bath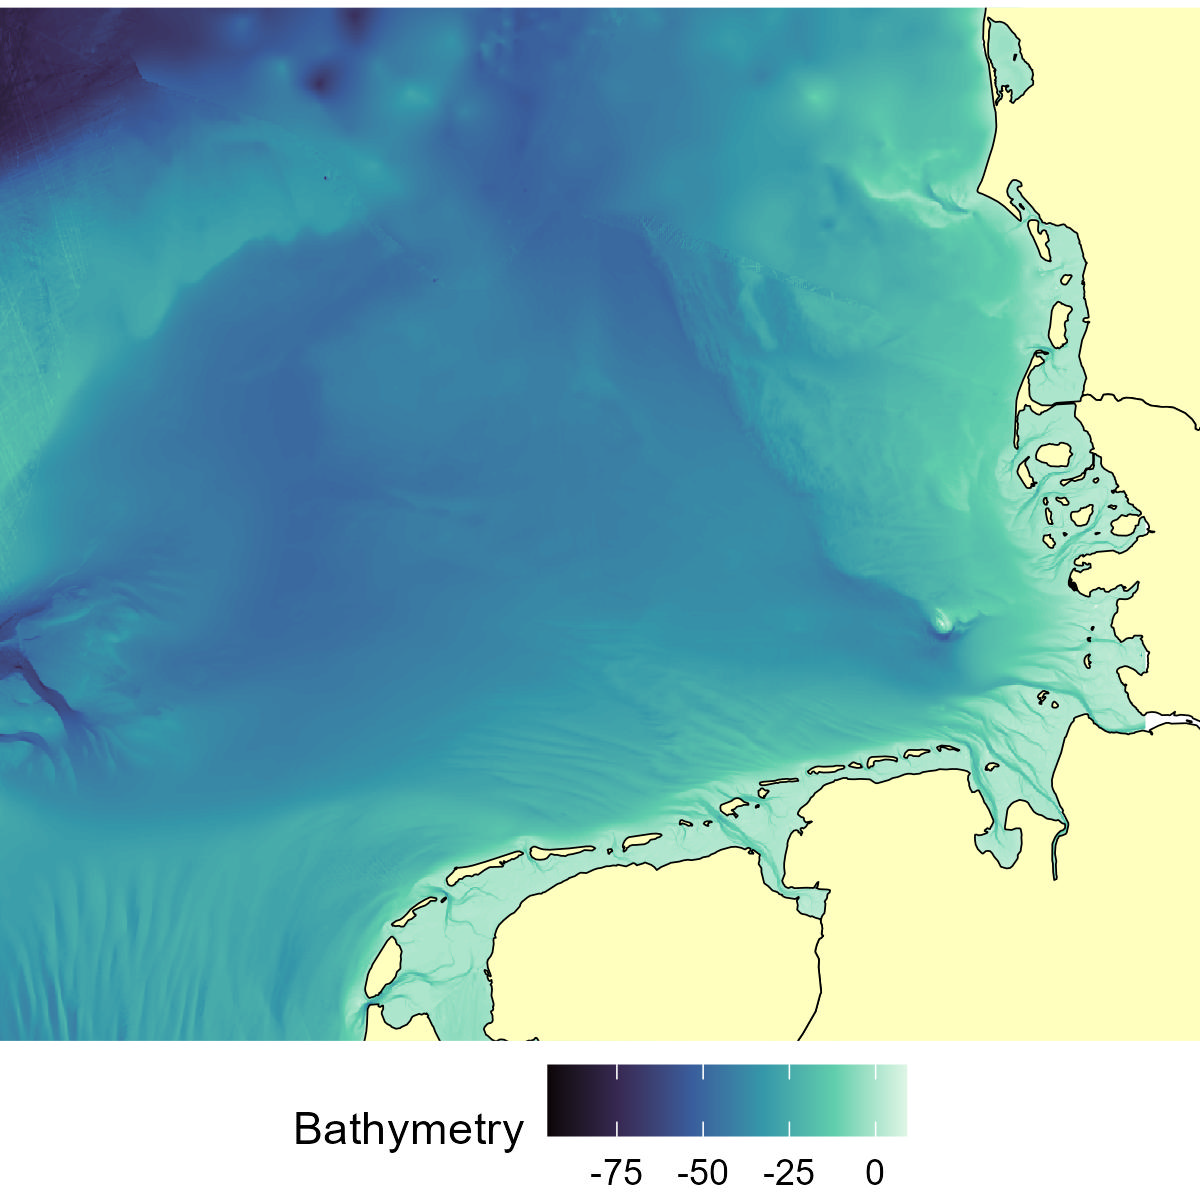
More details about how to add features to a map here