xlim1<--125.
xlim2<--88.
ylim1<-14.
ylim2<-35.Environmental variables
r
ggplot2
Y2024
gis
Download and plot SST data from a specific period.
Intro
This post is to create a map with environmental variables.
- Identify the data you want to download
- Download data from the server
- Create a basic map with the values
Define
Define the area you want to download the data from.
Define also the time frame you are interested in.
time1<-'2017-03-01T00:00:00Z'
time2<-'2017-03-30T00:00:00Z'
Load data
Load the package rerddap
library("rerddap")Check the list of available servers.
For the example, we are interested in the Pacific Ocean, therefore I would use NOAA.
servers()I want to download sea surface temperature (SST) data, therefore I will use erdMH1sstdmday
sstInfo <- info('erdMH1sstdmday')To check the specifications use browse
browse('erdMH1sstdmday') It takes some time to download.
SST03.2017<-griddap(sstInfo, latitude = c(ylim1, ylim2), longitude = c(xlim1, xlim2), time = c(time1,time2), fields = 'sst')To use ggplot, the format in dataframe works better.
SST03.2017dt<-SST03.2017$dataClear NaNs
library(tidyverse)SST03.2017dt_clean<-SST03.2017dt %>%
filter(sst!='NaN')Create plot
ggplot(SST03.2017dt_clean) +
 geom_raster(aes(x=longitude, y=latitude, fill = sst))+
  scale_fill_viridis_c(option = "H")
Add land for reference
Load the package rworldmap this includes shapefiles of countries
library(rworldmap)The function getMap() loads the map in your environment
worldMap <- getMap()Load the package tidyverse
Use the function fortify to be able to plot the map using ggplot
world.points <- fortify(worldMap)To plot using ggplot a data frame is recommended
world.points$region <- world.points$id
world.df <- world.points[,c("long","lat","group", "region")]
Create plot using ggplot
ggplot(SST03.2017dt) +
  geom_tile(aes(x=longitude, y=latitude, fill = sst))+ #geom_raster before
  geom_polygon(data = world.df, aes(x = long, y = lat, group = group), colour = '#403d39', fill = "#e5e5e5") +
  theme(
    axis.title = element_blank(),
    panel.border = element_rect(colour = "#495057", fill=NA, size=1),
    panel.grid = element_blank(),
    panel.spacing = unit(0, "lines"),
    plot.background = element_blank())+
    coord_sf(xlim = c(xlim1+2,xlim2-2),
             ylim = c(ylim1+2,ylim2-2))+
  scale_fill_viridis_c(option = "H")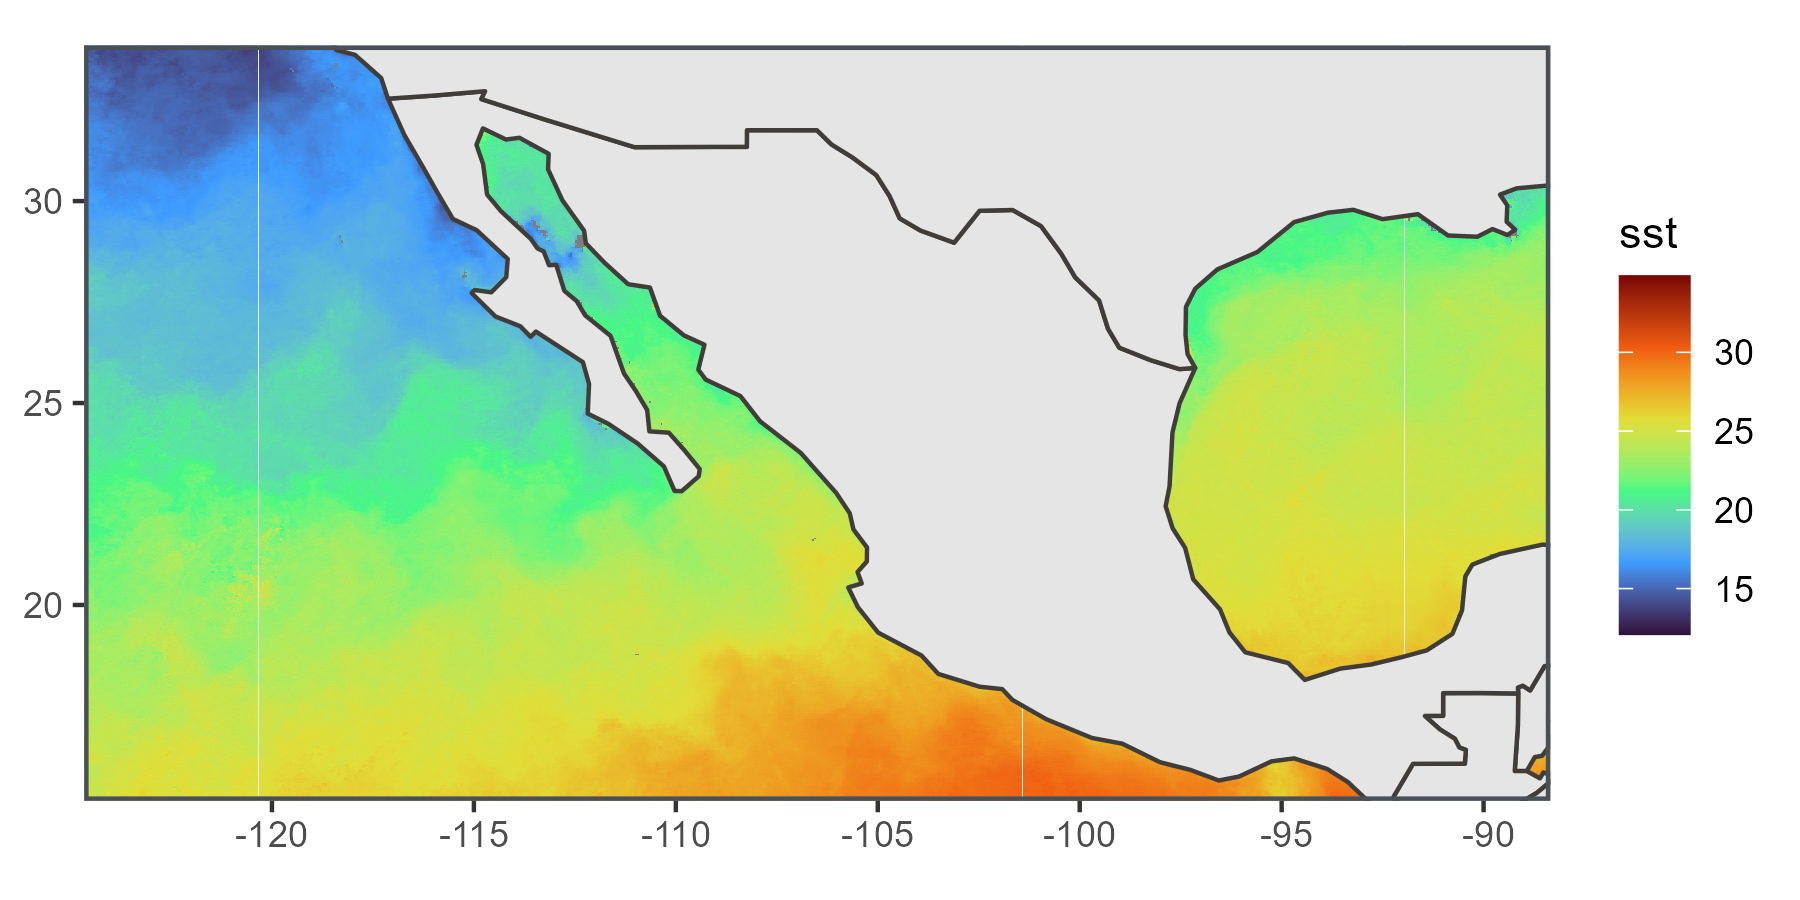
I hope the server did not failed you, sometimes is not working, also welcome geom_tile! I was using geom_raster before, which it works but why not joining the new way?