library(tidyverse)Create a calendar
r
ggplot2
Y2024
This post is to create a calendar.
Intro
This post is to create a calendar to check when some events were more likely to occur.
Packages
Data
Create a data frame with a sequence of days
firstday<- as.Date("2020-05-01")
lastday <- as.Date("2020-08-31")
days_seq <- seq(firstday, lastday, by = "day")
days_df<-as.data.frame(days_seq)
Separate months and days
days_df$month<-substr(days_df$days, start = 6, stop = 7)
days_df$day<-substr(days_df$days, start = 9, stop = 10)
Add values
my_values<-sample(1:7, 123, replace=TRUE)
days_df$events<-as.factor(my_values[1:123])
Separate months
may<-days_df %>%
  filter(month=='05')
Create x and y axis
calen_xs<-rep(c(1:7), times = 5)
calen_ys<-rep(c(5:1), each = 7)may$calen_xs<-calen_xs[1:31]
may$calen_ys<-calen_ys[1:31]Select color palette
my_palette <- c("1" = '#577590',
                "2" = '#43aa8b',
                "3" = '#90be6d',
                "4" = "#f9c74f",
                "5" = "#f8961e",
                "6" = "#f3722c",
                "7" = "#f94144")
Plot
ggplot(may,aes(x=calen_xs,y=calen_ys,color=events))+
  geom_point(size=25,shape=15)+

  scale_x_continuous(limits=c(0.5,7.5))+
  scale_y_continuous(limits=c(0.5,5.5))+

  # remove background colors
  theme_void()+

  # adds texts
  geom_text(aes(label=day),color='white') +

  # sets the legend below
  theme(legend.position = 'top')+

  # lines the legend
  guides(colour = guide_legend(override.aes = list(size=6),nrow = 1))+

  # uses palette
  scale_color_manual(name = "May no. events",values = my_palette)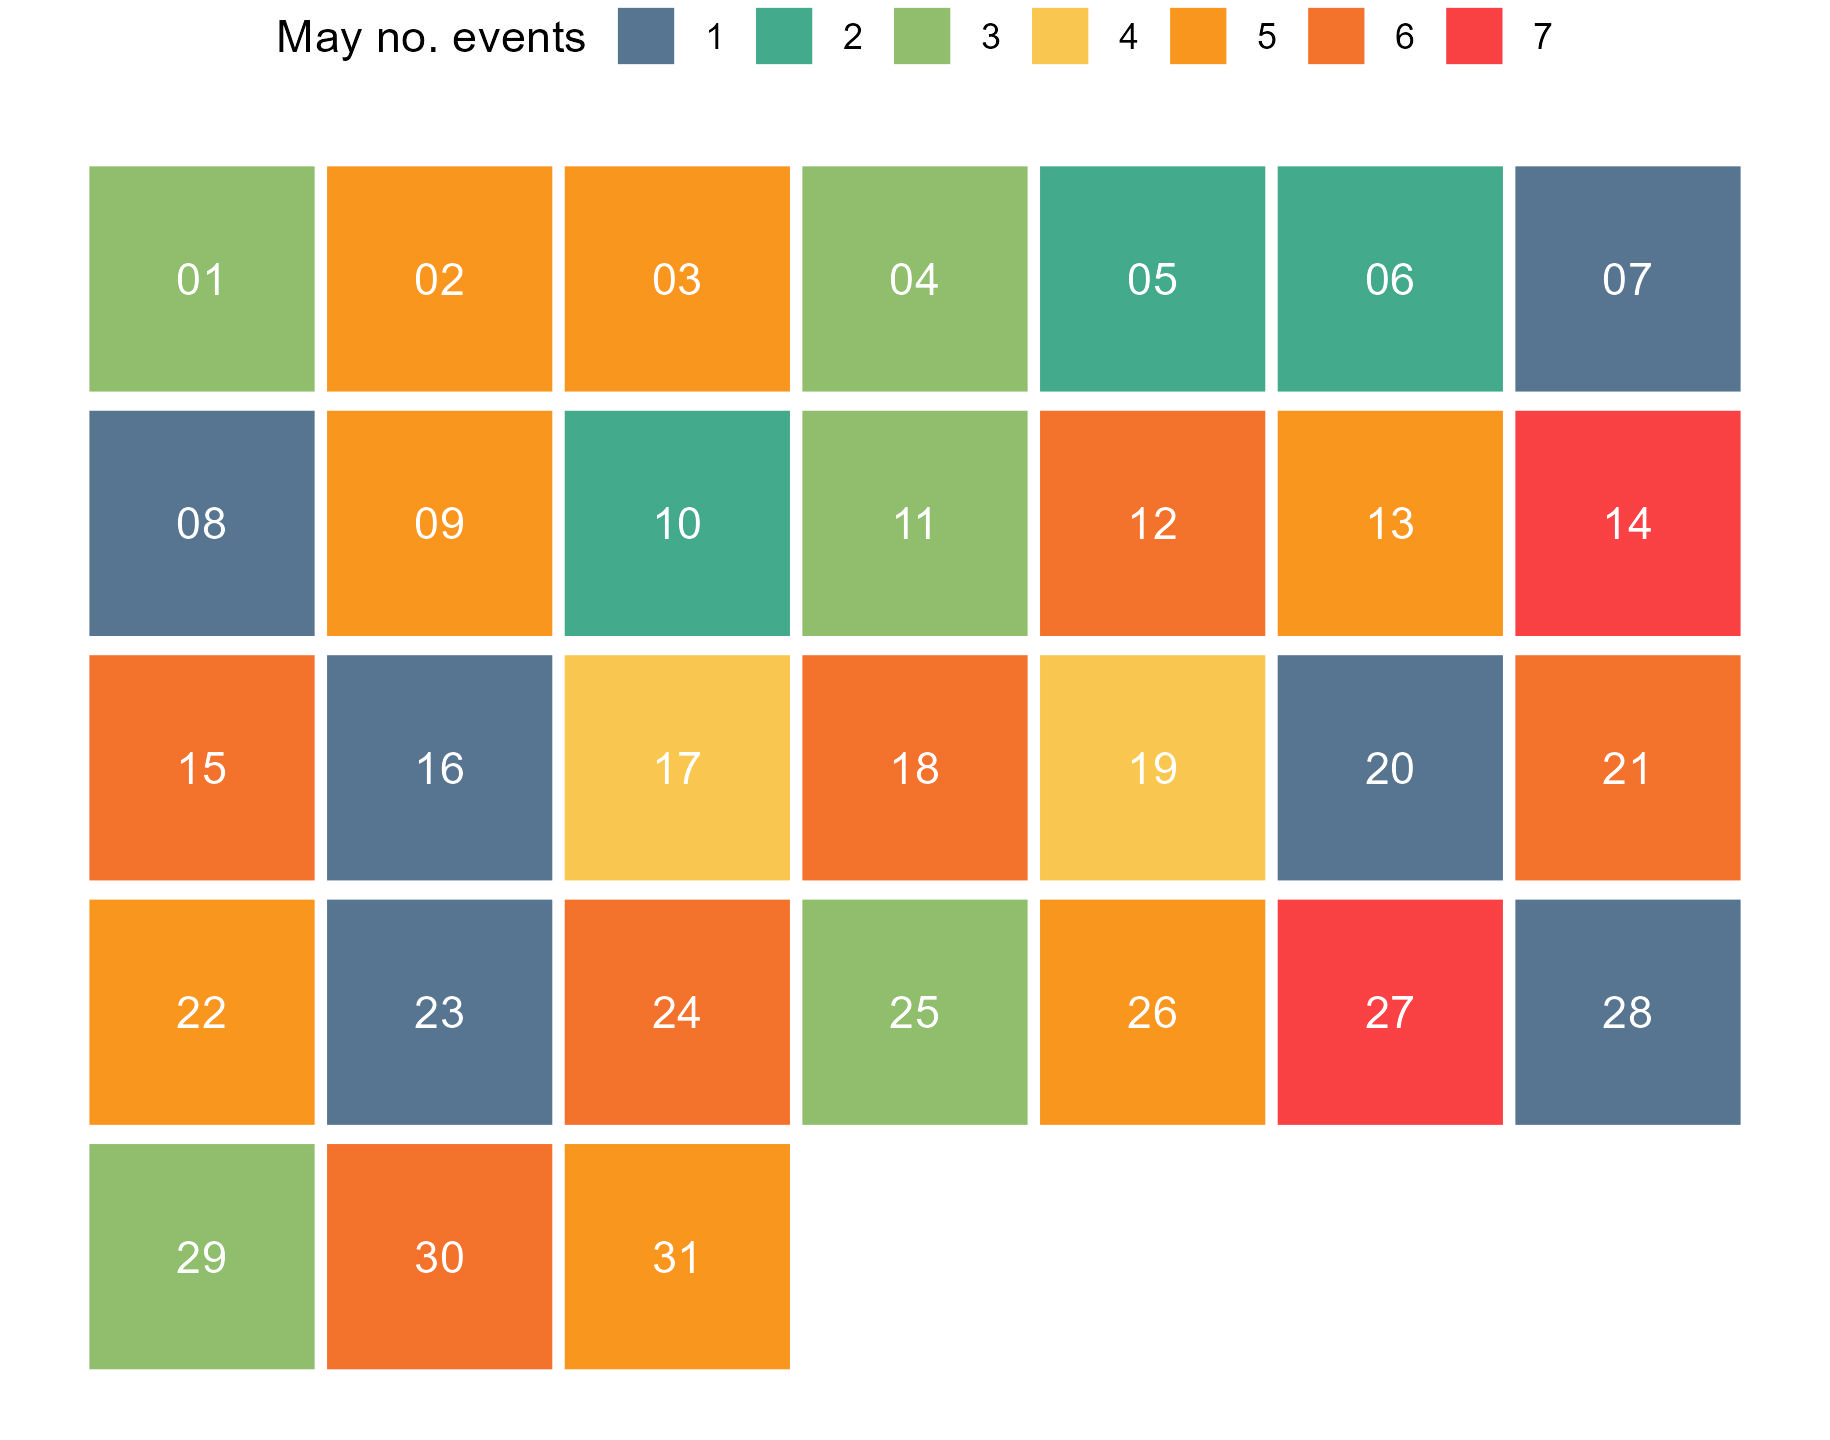
I used this to see which dates there were more surveys occurring, hope it helps!