#devtools::install_github("MiriamLL/sula")
library(sula)
GPS01<-(GPS01)Identify gaps
r
biologging
sula
Y2022
Find the gaps between recordings
Intro
This post is to find and calculate gaps between points.
For the exercises, test data is from masked boobies.
To access the data you have to install the package sula: devtools::install_github(“MiriamLL/sula”)
library(dplyr)Identify column with time date data
GPS01$dt <- as.POSIXct(strptime(GPS01$tStamp, "%Y-%m-%d %H:%M:%S"))Check gaps in time between recordings
GPS01$Gaps_time<-as.numeric(GPS01$dt - lag(GPS01$dt))Classify gaps
GPS01 <- GPS01 %>%
  mutate(Gaps_class = case_when(is.na(Gaps_time) ~ 'U',
                                Gaps_time <= 300 ~ 'Small',
                                TRUE ~ 'Large'))
Check gaps between locations
range(GPS01$Gaps_time,na.rm=TRUE)Create gap
To artificially create a gap, remove all locations between 13 and 14 hrs
GPS01$Hour <- as.numeric(substr(GPS01$dt, 12, 13))GPS01_wGap<-GPS01 %>%
filter(Hour != 13 & Hour != 14)Add row number
GPS01_wGap$seq<-seq(1:nrow(GPS01_wGap))Calculate lag
GPS01_wGap$Gaps_time<-as.numeric(GPS01_wGap$dt - lag(GPS01_wGap$dt))Classify gaps
Here, small gaps are when they were less than 15 min between locations
GPS01_wGap <- GPS01_wGap %>%
  mutate(Gaps_class = case_when(is.na(Gaps_time) ~ 'U',
                                Gaps_time <= 15 ~ 'Small',
                                TRUE ~ 'Large'))
When?
When did the gap occurred?
The result show the latest record, therefore the gap occurred between the previous recording and this one
Large_gaps<-GPS01_wGap %>%
  filter(Gaps_class=='Large')
Large_gaps
To see the previous line to see when the gap started you can select this and the previous row
all_rows<-c(Large_gaps$seq,Large_gaps$seq-1)GPS01_wGap %>%
filter(seq %in% all_rows)How much?
To calculate the duration of the gap in hours
GPS01_wGap$Gap_hrs<-GPS01_wGap$Gaps_time/60range(GPS01_wGap$Gap_hrs,na.rm=TRUE)Where?
Where did the gap occurred?
library(ggplot2)Each circle is the locations, the size of the circle is the gap between locations
ggplot()+
  geom_point(data = GPS01_wGap,
            aes(x=Longitude,y = Latitude,size = Gap_hrs),color='red')+
  geom_path(data = GPS01_wGap,
            aes(x=Longitude,y = Latitude),color='blue',size = 0.5)+
theme_bw()library(plotly)ggplotly(ggplot()+
geom_point(data = GPS01_wGap,
aes(x=Longitude,y = Latitude,size = Gap_hrs, color=Hour))+
geom_path(data = GPS01_wGap,
aes(x=Longitude,y = Latitude),color='blue',size = 0.5)+
theme_bw())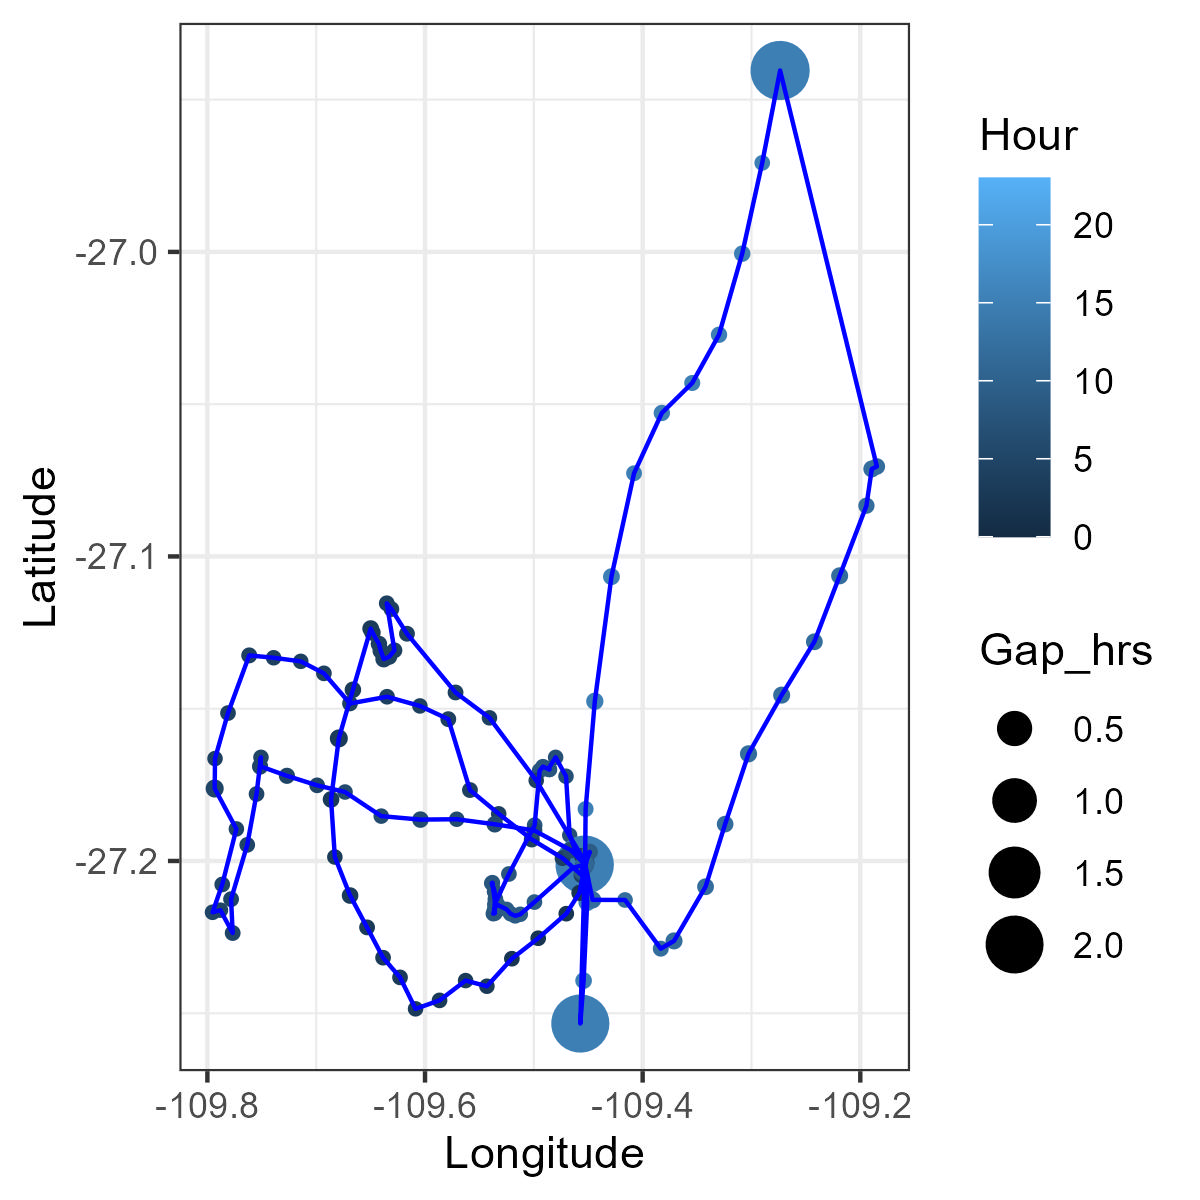
Further considerations
To solve issues with gaps there are several options:
Interpolate the tracking data to specific intervals.
For example: ‘Gaps in the tracking datasets were linearly interpolated using the adehabitatLT package in R in order to obtain tracks at 2 h time intervals.’ (Ventura et al. 2020; Raine t al. 2021).
Other options for interpolate tracking points here.
However, be cautious because large intervals will return a straight line that might under or overestimate some areas used.Define a threshold.
‘Incomplete trips (departure or return from/to the nest not registered)’ (Lerma et al. 2020; Fijn et al. 2022).
Note that including incomplete trips for calculating trip durations will not greatly affect the results. However, gaps in the tracking data might underestimate the true maximum distance used by the animal, and their total distance covered during the trip. Therefore it is not advisable to use it for this purpose.‘A track was considered to be complete whenever the GPS recorded 80% or more of the duration of the foraging trip.’ (Tarroux et al. 2020)
Use portions of the recordings of the incomplete tracks.
For example ‘… tracks were examined individually; only complete portions of tracks were used for analyses…’ (Young et al. 2010).
- Do not use incomplete tracks.
For example: ‘All records with incomplete information were excluded for the analyses’